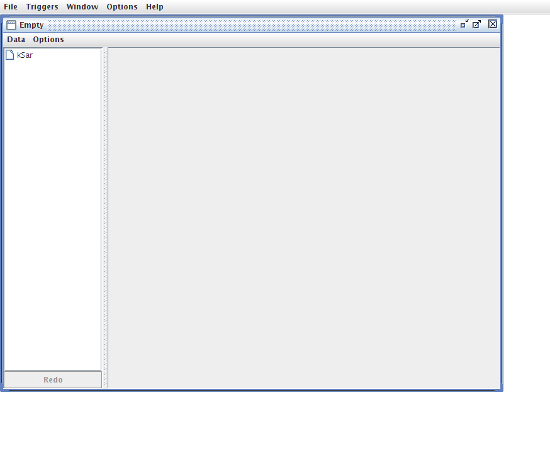
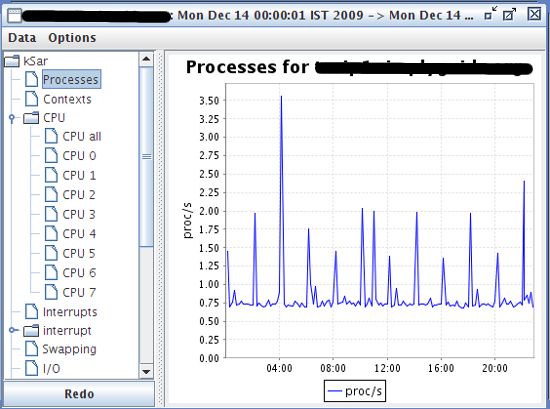
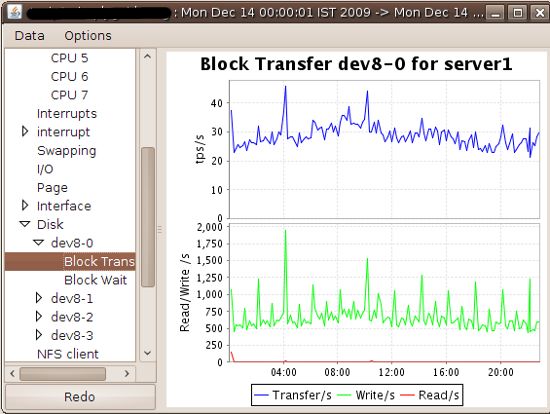
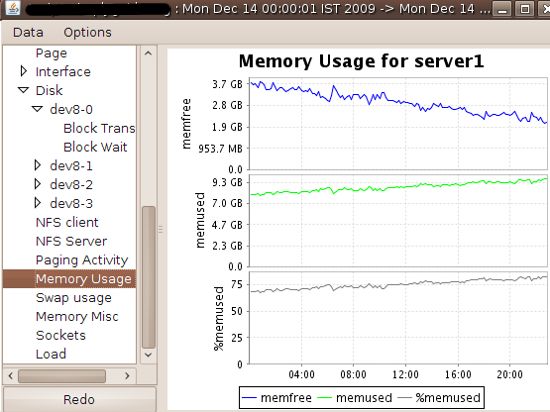
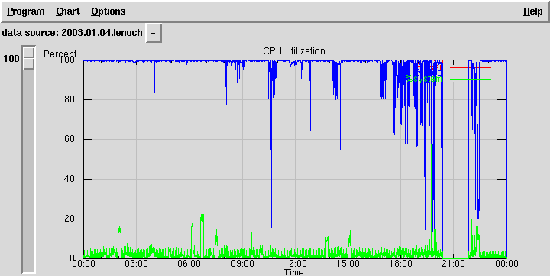
The sar command uses to collect, report, or save activity information for UNIX/Linux systems. It saves the selected counter to the operating system's /var/log/sa/sadd file. From the collected data, you can get a lot of information about your server: CPU usage Memory page and usage Network I/O and transmission statistics Process creation activity All block device activities Number of interrupts per second, etc. The output of the sar command can be used to identify server bottlenecks. However, analyzing the information provided by the sar command can be difficult, so use the kSar tool. The kSar tool can plot the output of the sar command into a time-cycle-based, easy-to-understand chart. Sysstat package The sar, sa1, and sa2 commands are all part of the sysstat package. It is a collection of performance monitoring tools included with Linux. Sar: display data Sa1 and sa2: Collect and save data for later analysis. The sa2 shell script writes a report daily in the /var/log/sa directory. The sa1 shell script writes daily system activity information to a file as binary data. Sadc - system activity data collector. You can configure various options by modifying the sa1 and sa2 scripts. They are located in the following directories: /usr/lib64/sa/sa1 (64-bit) or /usr/lib/sa/sa1 (32-bit) - It calls sadc to log the report to /var/log/sa/sadX format. /usr/lib64/sa/sa2 (64-bit) or /usr/lib/sa/sa2 (32-bit) - It calls sar to log the report to /var/log/sa/sarX format. How to install sar on my system? On a CentOS/RHEL-based system, enter the following yum command to install sysstat: Loaded plugins: downloadonly,fastestmirror,priorities, : protectbase, security Loading mirror speeds from cached hostfile *addons: mirror.cs.vt.edu *base: mirror.ash.fastserv.com *epel: serverbeach1.fedoraproject.org *extras: mirror.cogentco.com *updates: centos.mirror.nac.net 0packages excluded due torepository protections Setting up Install Process Resolving Dependencies --> Running transaction check ---> Packagesysstat.x86_640:7.0.2-3.el5set tobe updated --> Finished Dependency Resolution Dependencies Resolved =========================================================== ================== Package Arch Version Repository Size =========================================================== ================== Installing: Sysstat x86_64 7.0.2-3.el5 base 173k Transaction Summary =========================================================== ================== Install 1Package(s) Update 0Package(s) Remove 0Package(s) Total download size: 173k Isthisok[y/N]: y Downloading Packages: Sysstat-7.0.2-3.el5.x86_64.rpm | 173kB 00:00 Running rpm_check_debug Running Transaction Test Finished Transaction Test Transaction Test Succeeded Running Transaction Installing : sysstat 1/1 Installed: Sysstat.x86_640:7.0.2-3.el5 Complete! Sysstat configuration file Edit the /etc/sysconfig/sysstat file to specify how many days the log file will be saved (up to one month): # vi /etc/sysconfig/sysstat The sample output is as follows: # keep log for 28 days # the default is 7 HISTORY=28 Save and close this file. Find the default cron job for sar The default cron job is located in /etc/cron.d/sysstat: # cat /etc/cron.d/sysstat The sample output is as follows: # run system activity accounting tool every 10 minutes */10 * * * * root /usr/lib64/sa/sa111 # generate a daily summary of process accounting at 23:53 5323 * * * root /usr/lib64/sa/sa2 -A Tell sadc to report disk statistics Use a text editor to edit the /etc/cron.d/sysstat file, for example using the vim command, type the following: # vi /etc/cron.d/sysstat Update this file as in the example below to record all hard drive statistics (the -d option forces logging of statistics for each block device, while the -I option forces logging of all system interrupt statistics): # run system activity accounting tool every 10 minutes */10 * * * * root /usr/lib64/sa/sa1 -I -d11 # generate a daily summary of process accounting at 23:53 5323 * * * root /usr/lib64/sa/sa2 -A On CentOS/RHEL 7.x systems you need to pass the -S DISK option to collect data from block devices. Pass the -S XALL option to collect the data listed below: Disk Partition System interruption SNMP IPv6 # Run system activity accounting tool every 10 minutes */10 * * * * root /usr/lib64/sa/sa1 -SDISK11 # 0 * * * * root /usr/lib64/sa/sa1 600 6 & # Generate a daily summary of process accounting at 23:53 5323 * * * root /usr/lib64/sa/sa2 -A # Run system activity accounting tool every 10 minutes Save and close this file. Open the service for CentOS/RHEL version 5.x/6.x Enter the following command: Chkconfig sysstat on Service sysstat start The sample output is as follows: Calling the system activity data collector(sadc): For CentOS/RHEL 7.x, run the following command: # systemctl enable sysstat # systemctl start sysstat.service # systemctl status sysstat.service Sample output: â—sysstat.service - Resets System Activity Logs Loaded: loaded(/usr/lib/systemd/system/sysstat.service;enabled;vendor preset: enabled) Active: active(exited)since Sat2018-01-0616:33:19IST;3sago Process: 28297ExecStart=/usr/lib64/sa/sa1 --boot(code=exited,status=0/SUCCESS) Main PID: 28297 (code=exited,stat=0=SUCCESS) Jan0616:33:19centos7-box systemd[1]: Starting Resets System Activity Logs... Jan0616:33:19centos7-box systemd[1]: Started Resets System Activity Logs. How to use sar? How to view statistics? Use the sar command to display the cumulative activity counter output selected in the operating system. In this example, run the sar command line to get a report of CPU usage in real time: # sar -u 3 10 Sample output: Linux2.6.18-164.2.1.el5() 12/14/2009 09:49:47PM CPU %user %nice %system %iowait %steal %idle 09:49:50PM all5.660.001.220.040.0093.08 09:49:53PM all12.290.001.930.040.0085.74 09:49:56PM all9.300.001.610.000.0089.10 09:49:59PM all10.860.001.510.040.0087.58 09:50:02PM all14.210.003.270.040.0082.47 09:50:05PM all13.980.004.040.040.0081.93 09:50:08PM all6.606.891.260.000.0085.25 09:50:11PM all7.250.001.550.040.0091.15 09:50:14PM all6.610.001.090.000.0092.31 09:50:17PM all5.710.000.960.000.0093.33 Average: all9.240.691.840.030.0088.20 among them: 3 indicates the interval 10 times View the statistics created by the process, enter: # sar -c 3 10 To view I/O and transmission rate statistics, enter: # sar -b 3 10 View the memory page statistics and enter: # sar -B 3 10 To view block device statistics, enter: # sar -d 3 10 View all interrupted statistics and enter: # sar -I XALL 3 10 To view network device-specific statistics, enter: # sar -n DEV 3 10 # sar -n EDEV 3 10 To view CPU-specific statistics, type: # sar -P ALL # Only 1st CPU stats # sar -P 1 3 10 To view statistics on queue length and average load, enter: # sar -q 3 10 To view usage statistics for memory and swap space, type: # sar -r 3 10 # sar -R 3 10 To view the status of inodes, files, and other kernel table statistics, type: # sar -v 3 10 View system switching activity statistics, enter: # sar -w 3 10 View the exchange statistics and enter: # sar -W 3 10 To view an Apache process with a PID of 3256, type: # sar -x 3256 3 10 Introduction to kSar Sar and sadf provide output based on the command line interface. This output may make it impossible for novice users/system administrators to get started. Therefore, you need to use kSar, which is a Java application that graphically displays your sar data. It also allows you to export data in PDF/JPG/PNG/CSV format. You can load data in three ways: local files, running local commands, and commands that run remotely via SSH. kSar can handle sar output for the following operating systems: Solaris 8, 9 and 10 Mac OS/X 10.4+ Linux (Systat Version >= 5.0.5) AIX (4.3 & 5.3) HPUX 11.00+ Download and install kSar Visit the official website to get the latest version of the source code. Use wget to download the source code and type: $wget https://github.com/vlsi/ksar/releases/download/v5.2.4-snapshot-652bf16/ksar-5.2.4-SNAPSHOT-all.jar How to run kSar? First make sure that the JAVA jdk on your machine is installed and working. Enter the following command to start kSar: $java -jar ksar-5.2.4-SNAPSHOT-all.jar Next you will see the main window of kSar, and the panel with two menus. There is a list on the left that is a list of available charts that kSar has parsed based on the data. The right window will show you the chart you selected. How to use kSar to generate sar charts? First, you need to collect statistics for the sar command from the server named server1. Enter the following command: [server1]# LC_ALL=C sar -A > /tmp/sar.data.txt Next, use the scp command to copy from the local desktop to the remote computer: [desktop]$scp craft.com:/tmp/sar.data.txt /tmp/ Switch to the kSar window and click on "Data" > "Load data from text file" > select sar.data.txt from /tmp/ > click on the "Open" button. The chart type tree now appears in the left panel and a graphic is selected: Zoom in and out By moving you can interactively zoom a part of the image. Click on the upper left corner of the image to be zoomed and press the mouse to move to the lower right corner of the area to be zoomed to select the area to be zoomed. Return to the unzoomed state, click and drag the mouse to any position except the lower right corner, you can also click and select the zoom option. Learn about kSar images and sar data I highly recommend reading the man page of the sar and sadf commands: $man sar $man sadf Case Study: Identifying CPU Bottlenecks for Linux Servers Use the sar command and the kSar tool to get a detailed snapshot of the memory, CPU, and other subsystems. For example, if CPU usage continues to be above 80% for a long period of time, there may be a CPU bottleneck. With sar -x ALL you can find a lot of CPU-consuming processes. The output of the mpstat command (part of the sysstat package) will also help you understand CPU usage. But you can easily analyze this information using kSar. After finding out the CPU bottleneck... Perform the following adjustments to the CPU: Make sure that no unwanted processes are running in the background. Turn off all unwanted services on Linux. Use cron to run tasks (such as backups) during a non-peak hour. Use the top and ps commands to find all non-critical background jobs/services. Use the renice command to adjust low priority jobs. Use the taskset command to set the CPU used by the process (unloading the CPU used), that is, bind the process to a different CPU. For example, run the MySQL database on the 2# CPU and Apache on the 3# CPU. Make sure your system uses the latest drivers and firmware. If possible, add extra CPU to the system. Use a faster CPU for single-threaded applications (for example, Lighttpd web server applications). Use multiple CPUs for multi-threaded applications (for example, MySQL database server applications). Use multiple compute nodes for a web application and set up a load balancer. Isag - interactive system activity logger (alternative tool) The isag command graphically displays system activity data that was stored in a binary file when the sar command was previously run. The isag command references sar and extracts its data to draw the graph. Compared to kSar, isag has fewer options. Stainless Steel Pipe,Medical Ss Capillary Pipe,Stainless Steel Tubes,Seamless Presion Stainless Steel Tube ShenZhen Haofa Metal Precision Parts Technology Co., Ltd. , https://www.haofametals.com

October 14, 2023