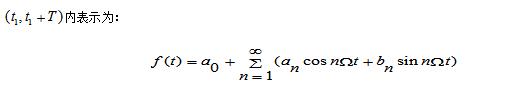
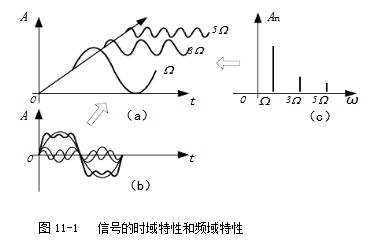
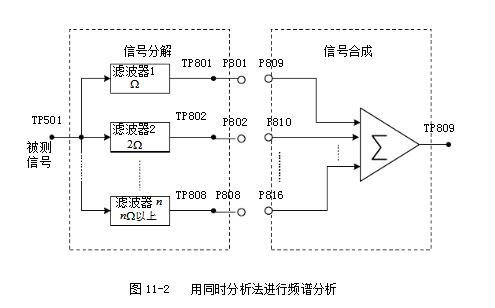
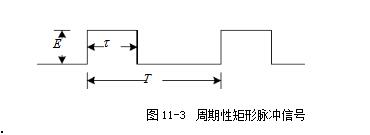
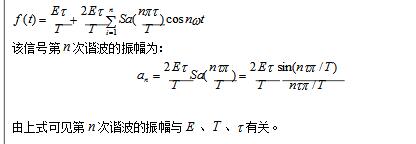
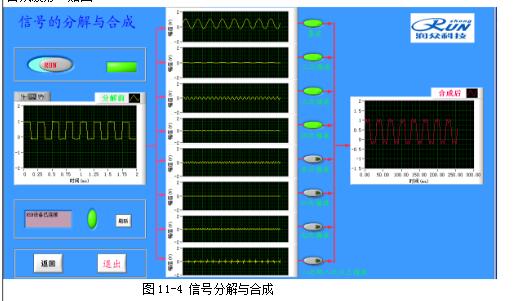
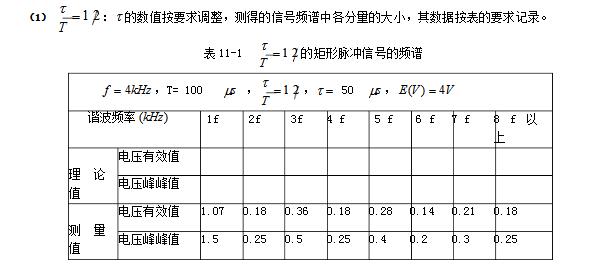
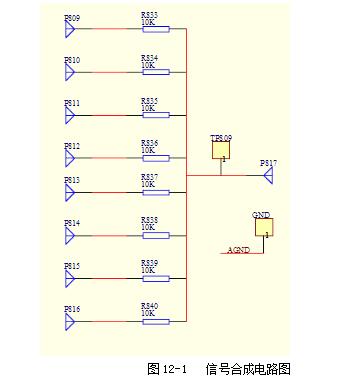
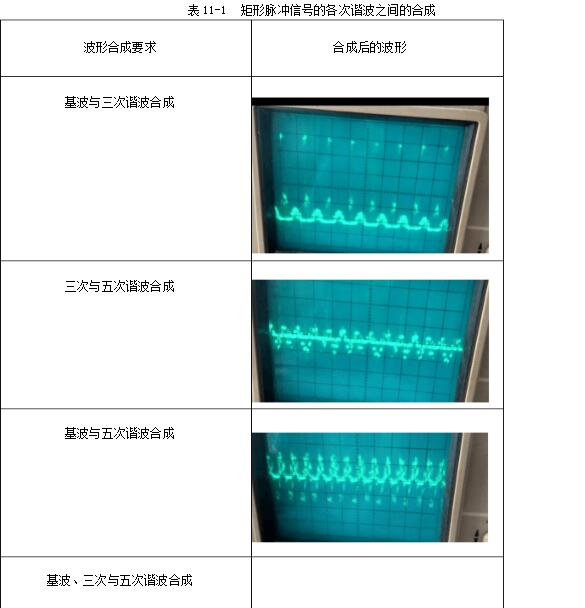
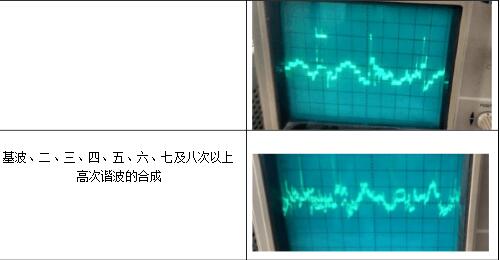
A rectangular pulse refers to a flat-top pulse with a step time much less than the top duration. Definition 1 The rectangular pulse graphic representation is shown in the figure: (height is A, width is a). This function is often used as a model for rectangular sampling windows and smoothing functions. Definition 2 A waveform having a contour that is approximately rectangular and whose rise and fall times are much smaller than the pulse duration. Definition 3 The step time is much smaller than the flat top pulse of the top duration. Definition 4 The rise and fall times are negligible with respect to the pulse duration, and the instantaneous value between rise and fall is virtually constant for a one-way pulse. This article mainly introduces the decomposition and synthesis of rectangular pulse signals. Let's take a look at the small series. First, the purpose of the experiment 1. Analyze the typical rectangular pulse signal to understand the composition of the harmonic components of the rectangular pulse signal; 2. Observe the case where the rectangular pulse signal passes through a plurality of digital filters and decomposes the harmonic components. Second, the experimental principle 1. Spectrum and measurement of signals The time domain and frequency domain characteristics of a signal are two different ways of describing a signal. For a time domain periodic signal f(t), it can be expanded into a triangular or exponential Fourier series as long as it meets the Dirichlet condition. For example, for a time domain periodic signal with a period T, f(t), the triangular Fourier series can be used to find its respective components in the interval. The signal is decomposed into a DC component and many cosine components and sinusoidal components to study its spectral distribution. There is a close intrinsic link between the time domain characteristics of the signal and the frequency domain characteristics. This connection can be visualized using Figure 11-1. Figure 11-1 (a is the graph of the signal in the amplitude-time-frequency three-dimensional coordinate system; Figure 11-1(b) is the graph of the signal in the amplitude-time coordinate system, ie the waveform diagram; The harmonic components obtained by the periodic signal decomposition are arranged according to the frequency, and the spectrum map can be obtained. The spectrum reflecting the amplitude of each frequency component is called the amplitude spectrum. Figure 11-1(c) shows the amplitude-frequency coordinates of the signal. The graph in the system is the amplitude spectrum map. The spectrum reflecting the phase of each component is called the phase frequency. Spectrum. In this experiment, only the signal amplitude spectrum is studied. The amplitude spectrum of a periodic signal has three properties: discreteness, harmonicity, and convergence. These properties are utilized in the measurement. From the amplitude spectrum map, the proportion of each frequency component can be visually seen. The measurement methods include simultaneous analysis and sequential analysis. At the same time, the basic working principle of the analysis method is to use multiple filters to adjust their center frequencies to the respective frequency components of the signal under test. When the signal to be measured is simultaneously applied to all filters, the filter whose center frequency coincides with the frequency of a certain harmonic component contained in the signal has an output. The frequency components contained in the signal can be simultaneously measured in the actual time when the measured signal occurs. In this experiment, simultaneous analysis was used for spectrum analysis, as shown in Figure 11-2. Among them, P801 is the fundamental frequency signal, that is, the fundamental wave; P802 is the second harmonic; P803 is the third harmonic, and so on. 2. Spectrum of rectangular pulse signal A rectangular pulse signal with amplitude E, pulse width Ï„, and repetition period T, as shown in Figure 11-3. Its Fourier series is: 3. Decomposition extraction of signals Signal decomposition and extraction is an essential task of the filtering system. When we are only interested in certain components of the signal, we can use a frequency selective filter to extract the useful parts and filter the other parts. At present, the digital filter composed of DSP digital signal processing system has basically replaced the traditional analog filter, and the digital filter has many advantages compared with the analog filter. The digital filter composed of DSP has the advantages of high flexibility, high precision and high stability, small size, high performance and easy implementation. So here we have chosen a digital filter to achieve signal decomposition. On the digital filter module, the D/A converter TLV5608 (U502) with 8 outputs is selected. Therefore, 8 filters (one low pass, six band pass, one high pass) are designed to decompose the complex signal. Several harmonics. The eight signals that are decomposed and output can be observed with an oscilloscope. The measurement points are 8TP01, 8TP02, 8TP03, 8TP04, 8TP05, 8TP06, 8TP07, and 8TP08. 4, signal decomposition simulation The experiment box provides USB or network port based acquisition software and LABVIEW simulation software. The frequency component and synthesized waveform of the real-time signal can be observed on the PC, as shown in Figure 11-4. Instructions: The software is installed in Experiment 17, select the “Signal Synthesis and Decomposition†in the “Signal and System†check box, the experiment box DSP runs in the “Virtual Instrumentâ€, connect the experiment box and PC with the USB cable, and click the software “STOP†button. The software started shipping. Click the right side switch of the harmonic component to select the corresponding signal to participate in the synthesis; Third, the experimental steps (1) Connect DDS1 and 8P09; (2) Adjust the signal source so that DDS1 outputs f=4KHz, the duty signal is 50% pulse signal, adjust 1W1 to make the signal amplitude 4V; (3) Press the 8SW2 button to make the program indicator D3D2D1D0=0101, indicator light Corresponding signal decomposition; (4) The oscilloscope can be 8TP01, 8TP02, 8TP03, 8TP04, 8TP05, 8TP06, 8TP07, 8TP08 The waveform of each harmonic of the observed signal; (5) The pulse amplitude and frequency of the rectangular pulse signal remain unchanged, changing the pulse width ï´ of the signal (ie changing the duty cycle), and measuring the magnitude of each component in the signal spectrum when different ï´ values ​​are measured; (6) Experiment according to the values ​​given in Table 11-1 and Table 11-2, and record the data obtained from the experiment and fill in the table. Note: 4 jumpers 8K1, 8K3, 8K5, 8K7 should be placed in the left position. The function of the four jumpers is: when placed in the left position, the signal amplitude remains unchanged; when placed in the right position, the amplitude of each harmonic can be adjusted by four potentiometers 8W1, 8W3, 8W5 and 8W7 respectively. size. Fourth, the experimental report requirements 1. Record the experimental data as required and fill out Table 10-1 and Table 10-2. 2. Depicting the amplitude spectrum of the three measured signals. Five, experimental equipment 1. Signal and system experiment box 1 2, double trace oscilloscope 1 3, millivolt table 1 First, the purpose of the experiment 1. Learn more about the principles of waveform decomposition and synthesis; 2. Further master the method of harmonic analysis using Fourier series; 3. Observing the harmonic components decomposed by the rectangular pulse signal, the original rectangular pulse signal can be synthesized by superposition. Second, the experimental principle description The experimental principle section refers to Experiment 11, the decomposition experiment of rectangular pulse signal. The harmonic components of the rectangular pulse signal output through the 8-channel filter can be synthesized and restored to the original input rectangular pulse signal through an adder, and the synthesized waveform can be observed by the oscilloscope at the observation point TP809. If the filter is designed correctly, the original signal before the decomposition (observed TP101) and the synthesized signal should be the same. The composite circuit diagram of the signal waveform is shown in Figure 12-1. Third, the experimental steps This experiment is a continuation of the previous experiment. 1. Connect DDS1 and 8P09, and place 4 jumpers 8K1, 8K3, 8K5, 8K7 in the left position; 2, adjust the signal source, so that DDS1 output f = 4KHz, the duty cycle is 50% of the pulse signal, adjust 1W1 to make the signal amplitude is 4V; 3. Press the 8P09 button to make the program indicator D3D2D1D0=0101, and the corresponding signal of the indicator light is decomposed; 4. The oscilloscope can observe the waveforms of each harmonic of the signal on 8TP01, 8TP02, 8TP03, 8TP04, 8TP05, 8TP06, 8TP07, and 8TP08 respectively. 5, 8 jumpers 8SK1 - 8SK8, according to the contents given in the table below, try different connection methods (such as fundamental and third harmonic synthesis, just call 8SK1, 8SK3 to the composite position), and then Simultaneously measure DDS1 and 8TP12 with a dual trace oscilloscope, and record the waveform of 8TP12 in the following table. The output amplitude of 8TP12 can be changed by adjusting potentiometer 8W8. 3. Observe and record the synthesis results at the output according to the requirements of Table 12-1. Fourth, the experimental report requirements 1. According to the display results on the oscilloscope, fill in the form 11-1. 2. Rectangular pulse signal is taken as an example to summarize the principle of decomposition and synthesis of periodic signals. Five, experimental equipment 1. Signal and system experiment box 1 2, double trace oscilloscope 1 IP65 Waterproof Membrane Switch
Waterproof Membrane Switch is mainly characterized by coating a waterproof insulation layer on the conductive line surface so that the conductive line does not directly contact the pressure sensitive rubber layer. In addition, no holes shall be opened within 5m/m of the distance between the up-and-down road surface and the conductive line, and the interlayer air holes shall not be communicated with the outside world. Thus, the insulation resistance drop of conducting circuit caused by the moisture absorption of rubber layer and the impregnation and penetration of water into the circuit are improved. Therefore, it has the advantages of good waterproof and moisture-proof performance. Therefore, not waterproof membrane switch is not with the above requirements, but also can not have waterproof performance. The waterproof film switch has the characteristics of: the use of high-performance waterproof material processing, so that the product is used in 95% of the wet environment. No worries about rain, can be used in harsh conditions.
Ip65 Waterproof Membrane Switch,Silicone Membrane Keypad,Up And Down Membrane Keypad,3Pin Terminal Membrane Keypad Dongguan Nanhuang Industry Co., Ltd , https://www.soushine-nanhuang.com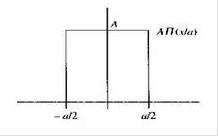
Introduction to pulse signals
March 05, 2023